
Racial Equity Data
Each year, our community data partners collect information for various demographic fields when assessing clients seeking services. Obtaining data about fields such as race and gender identity is integral to analyzing where our system may be falling short. By identifying the demographic groups which are disproportionately experiencing homelessness, we begin to understand where systemic inequities persist in TN-501, allowing our system to evolve and better serve our unique community.
Below you can find 2022-2023 data regarding racial equity and gender identity in Memphis and Shelby County. Additionally, you may find links to supplemental resources which may assist in constructing a more complete idea of how poverty and housing insecurity presents. All TN-501-specific information has been obtained from the Point-in-Time Count data and HMIS universe of data from our community. All data regarding the general population has been pulled from the U.S. Census.
Additional Resources:
U.S. Census Household Pulse Survey – Updated weekly, this interactive dashboard presents an up-to-date body of information about potential indicators of housing insecurity for each state.
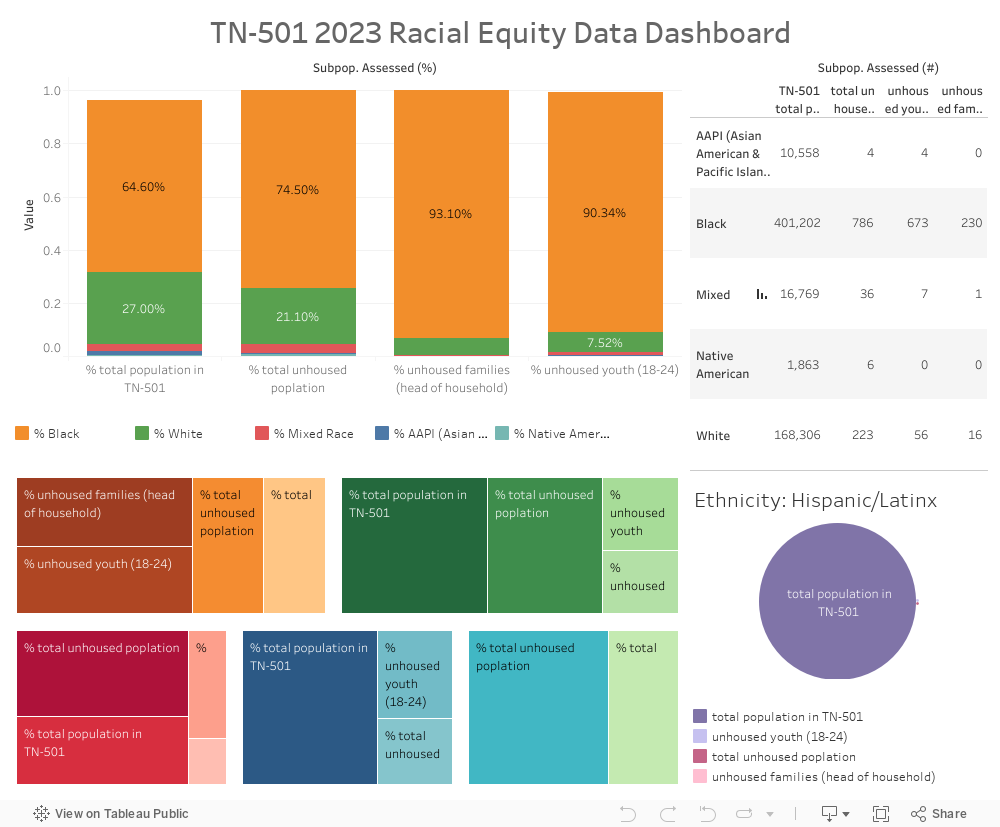
Above are data points highlighting various disparities in race and ethnicity.
Subpopulation Racial Makeup Assessment: The top left graph compares the 2023 demographic makeup of the total population of Memphis, the total unhoused population in TN-501, unhoused families in TN-501, and unhoused youth in TN-501.
Data Chart: The top right chart presents the unvisualized count for each intersection.
Demographic Ratio Comparison: The bottom left graphics elaborate on the Subpopulation Racial Makeup Assessment graphic by comparing the ratio from each subpopulation for each demographic. Note: this section pulls out the proportions of each racial demographic (ie; Black, White, AAPI, etc.) within each larger population (ie; youth, families, general population etc.), and presents them together in one dataset. This allows you to compare, and assess how equitable our system is currently. THe leftmost/darkest/ largest box in the dataset is the highest ration, and the rightmost/lightests/smallest box is the smallest population. Sets with greater variation present greater inequity.
Ethnicity: The bottom right graphic depicts how ethnicity informs risk in TN-501 based on the community data.
When individuals identifying as White make up 27% of the total Memphis population, White individuals should present in a proportional ratio in data regarding those experiencing homelessness. The data visualizations above depict that this is not the case. Only 21% of individuals experiencing homelessness identify as White, and for families and youth, an even smaller percent of the population identifies as White. Conversely, individuals identifying as Black make up 65% of the total Memphis population, but 75% of the individuals homeless population, and over 90% of both youth and family homeless populations. The inconsistency in proportions makes a compelling argument that, while affordable housing is a growing issue throughout TN-501, BIPOC are more likely to experience housing insecurity and homelessness across the board. Our data clearly indicates that systemic inequity is affecting the broader housing landscape in Memphis and Shelby County.